Summary
Key observations from these studies are:
- The instrument produces smooth, low-noise sinusoidal signals consistent with Malus's law, enabling reliable phase extraction through curve fitting
- Optical rotation is determined from full-waveform analysis (~8000 points per rotation), rather than single-point (null) detection
- Repeated measurements show a high degree of consistency under stable conditions
- The instrument is capable of tracking gradual changes in rotation over extended periods, enabling kinetic studies
Taken together, these results demonstrate that the PicoPOL is capable of quantitative optical rotation measurements with sufficient stability and internal consistency for teaching laboratories and exploratory experimental work.
(i) Optical Activity of Carvones
A good first experiment compares the waveforms recorded by the instrument when measuring a blank and a pair of enantiomers. To do this we fill two polarimeter cells – one with the naturally occurring enantiomer R-(-)-carvone and the other with S-(+)-carvone. These enantiomers are major components in the oils extracted from the spearmint and caraway plants, respectively, and are commercially available (e.g. from Sigma Aldrich). The chemical structures of these two enantiomers are shown below.
On the right we see waveforms acquired by the instrument for the blank and for the two carvones. The two enantiomers show quite sizeable but different phase shifts compared to the blank. In addition, there is significant optical attenuation due to absorption of the yellow light by the two samples; more so in the R-(-) enantiomer than in the S-(+) one.
From these measurements the optical rotations of the liquids are determined to be S-(+), 55.310 and R-(-), -56.560. Since the density of S-(+) carvone is 0.96 g/ml and the literature value for its specific rotation is 60.2 deg dm-1 (g/ml)-1, one expects this liquid to have an optical rotation of 57.80 when measured in a 10 cm cell. One concludes that the enantiomeric purity of this sample is ~98%, with the corresponding figure being slightly higher for the R-(-) isomer.
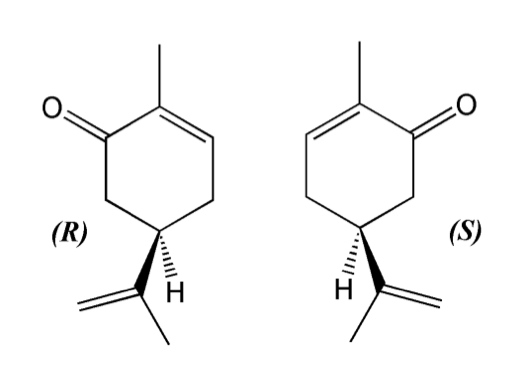
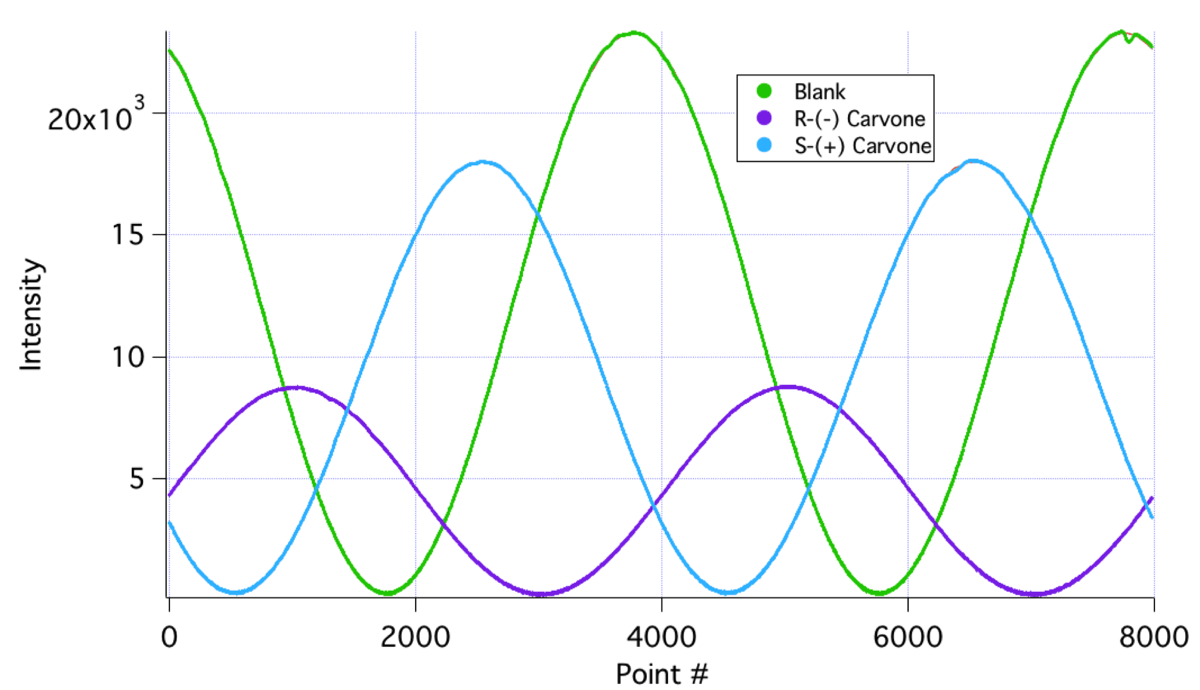
Structures of the two carvone optical isomers (left) and the 8000 point waveforms (and fits) acquired by the instrument for a blank, and for the two carvone samples (right).
(ii) Sucrose Calibration Curves
The specific rotation of aqueous solutions of sucrose at 20.0°C measured at a wavelength of 589 nm (the sodium "D" line, or the centre of the two yellow lines of the sodium lamp) is given by the ICUMSA as:
α = 66.588 ± 0.002 deg dm-1 (g/ml)-1
Based on the relationship between the specific rotation and observed rotation discussed earlier, a plot of a sample’s observed optical rotation (θ) versus concentration should be linear and this is the basis for the use of polarimetry for quantitative analysis. (Sugar measurements are routinely made in the food and wine industries).
The relationship between optical rotation and sample concentration can be explored using a series of sucrose solutions made up in six different glass cells designated A-F (each having a nominal path length of 10 cm) and covering the concentration range from 0 - 0.1 g/ml. The same set of solutions was used to record readings with IR, red, yellow, green, blue and violet LED’s in the light source end of the instrument.
The data sets and calibration curves obtained from these measurements are shown below. Here, the R2 values for the linear regressions lie in the range 0.9990-0.9996. Measurements revealed that the optical path lengths of the various sample cells showed some slight differences (the longest 9.97 mm being for cell C and the shortest 9.77 mm for cell E); when these differences are factored in, the fits would be further improved.
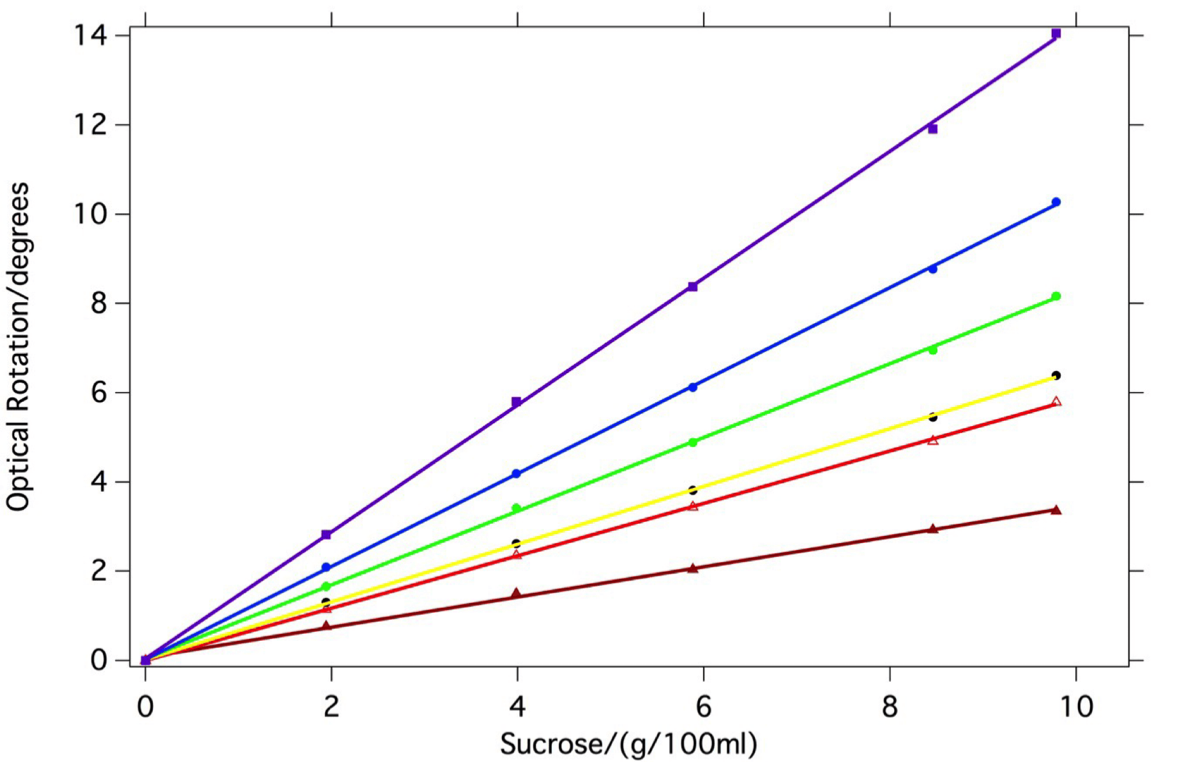
Optical rotation measurements on a series of sucrose solutions spanning the concentration range from 0 to 10g per 100 ml. Regression lines are shown for each of six different LED’s; the longest wavelength measurement is at the bottom and the shortest wavelength at the top.
Optically active samples typically show an increase in their observed optical rotation at shorter wavelengths. The slopes of the sucrose curves clearly show this to be the case here; this experiment in effect measures point-wise the optical rotatory dispersion curve of sucrose (see later).
The data also reveal that although polarimeters have traditionally used the Na D-line emission for measurements, greater analytical sensitivity can be realized by using shorter wavelengths. Consequently, the instrument can be fitted with LEDs having wavelengths other than 590 nm.
A possible extension activity based on the above measurements is to use the polarimeter to investigate the sugar concentrations in commercially available soft drinks containing both sugar and artificial sweeteners.
(iii) Sucrose Hydrolysis
Hydrolysis of sucrose into a 1:1 mixture of the sugars D-glucose and D-fructose occurs readily under the influence of acid and can also be enzyme-catalyzed.
The plot shows the results of a typical sucrose acid hydrolysis experiment. Here, 4 mL of concentrated hydrochloric acid are rapidly mixed with 21 mL of a 40 wt% solution of sucrose and the acidified solution is then quickly transferred to a polarimeter cell after data logging has commenced. Optical rotation values are logged over nearly an hour with the temperature during this experiment being 22 °C.
Initially the optical rotation is positive, but as the sucrose hydrolyzes to an equimolar mixture of glucose and fructose, the rotations decrease. D-fructose has a large negative specific rotation ([α]=-89.50) while the value for D-glucose is positive ([α]=+52.70).
As a consequence of these values the optical rotation undergoes a sign inversion during the run. When the reaction goes to completion the 1:1 final mixture of the two sugars is sometimes referred to as “invert sugar”. Taking into account the initial and final concentrations of the 3 sugars (in g/mL) and further assuming no volume change during the reaction, one predicts the final optical rotation to be 31.6% of the initial rotation but with a negative sign - in good agreement with what we observe here.
The rate of sucrose hydrolysis can be found by analyzing the data according to first order kinetics. Using the interactive graphics software IGOR (from Wavemetrics), the optical rotation data are fit to the functional form θ = θ0 + A exp[-kt] - the fit (black trace) is shown superimposed on the data (red circles). From the fit parameters one obtains a rate constant for hydrolysis k = 2.59 x 10⁻³ s-1 for this run.
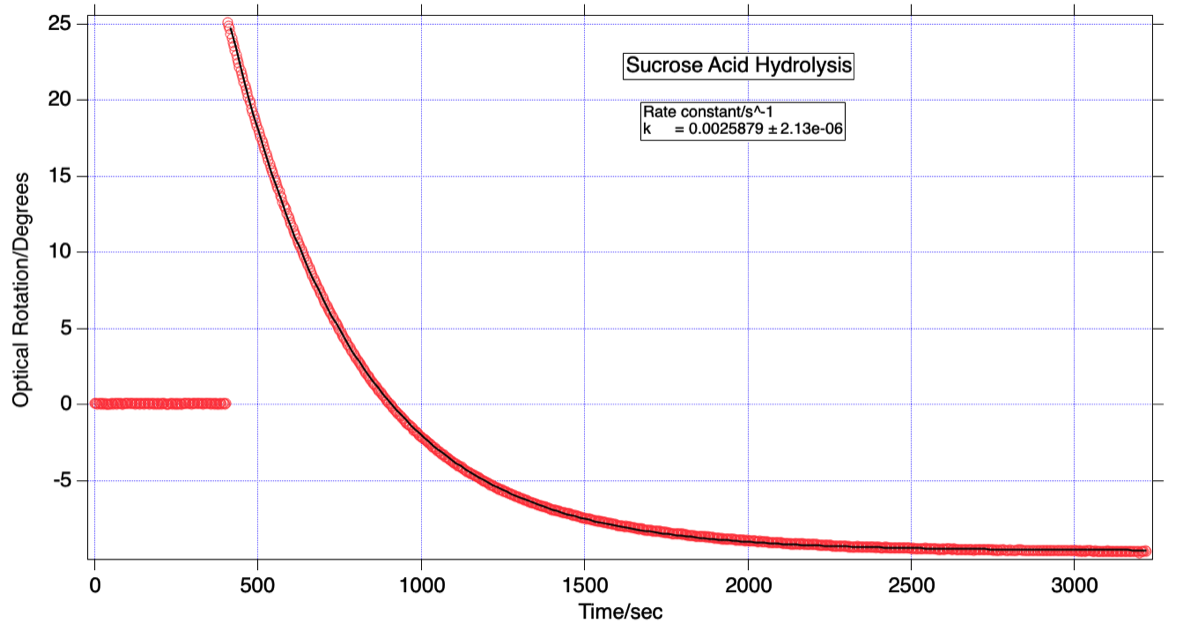
Optical rotation readings as measured during a sucrose acid hydrolysis experiment. An exponential fit is superimposed on the raw data.
(iv) Mutarotation of α-D Glucose
Glucose can exist in both open chain and cyclic structures, with the latter having two anomeric forms known as α-glucose (trans) and β-glucose (cis), differing only in the relative positioning of the hydroxyl group at the C-1 position and the -CH2OH group at C-5. Inter-conversion between these two forms in solution is known as mutarotation, with a change in optical rotation accompanying this process on account of the different specific rotations of the two anomeric forms : α (+112.20) and β( +18.70).
To study this process 5g of crystalline α-D-glucose and 0.5 mL of 2M sulphuric acid are placed in a 50 mL volumetric flask that is quickly made up to the mark with distilled water. The resulting solution is immediately transferred to a polarimeter cell and the optical rotation monitored over a period of several hours. Representative results (experimental rotations and fit) are shown below. The optical rotation decreases as the α-anomer converts to the β-anomer as equilibrium is approached. The literature value for the specific rotation of glucose is +52.70, which indicates that at equilibrium, 36% of the α- form and 64% of the β- form are present.
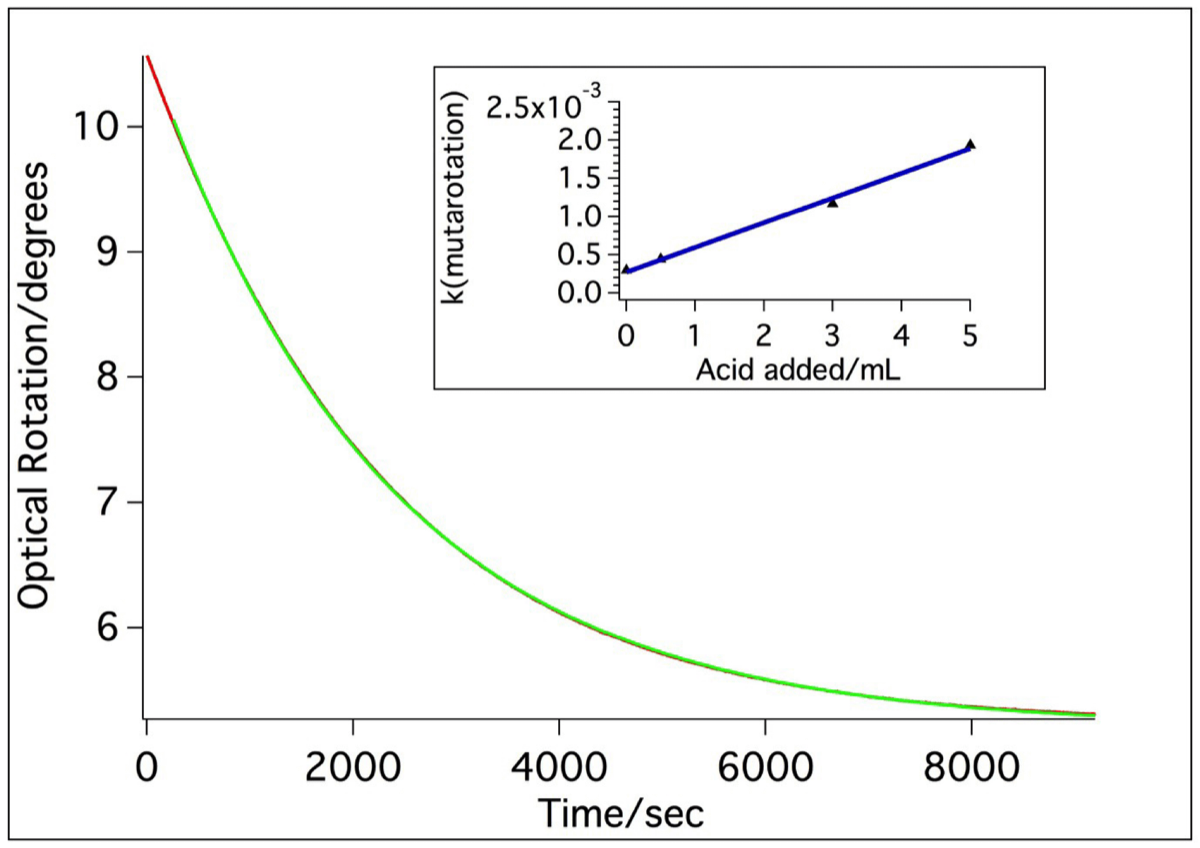
Optical rotation readings recorded during mutarotation of α-D-glucose. Both the raw data and a fit to an exponential function are shown. The inset shows the variation of the apparent rate constant with increasing acid concentration.
Mutarotation is acid-catalyzed, with a rate law that has both a constant term and a term linear in [H+], ie
Rate = (k0+k1[H+])[α-D-glucose]
By performing a series of experiments in which the acid concentration was varied and by plotting the pseudo first order rate constant krun versus [H+] (shown in the inset above) the values k0 = 2.74x10⁻⁴ s-1 and k1 = 0.011 M-1s-1 are found for this process. The temperature remained within the range 23°C-25°C during the course of these measurements.
(v) Pointwise Measurement of Optical Rotatory Dispersion Curves
Optical rotation is wavelength-dependent, as seen in the previous experiments with sucrose. The specific rotation [α] of a sample and the measurement wavelength λ are related by the Drude relationship,
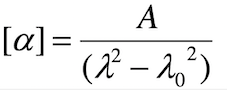
Here, Α and λ0 permit the sample’s specific rotation (and hence the observed rotation) to be predicted at any wavelength λ, with optical rotation increasing rapidly as the measurement wavelength approaches that of an absorption feature.
To demonstrate the validity of the Drude relationship using our polarimeter, we set up a high brightness 1W Luxeon white LED in front of the entrance slit of a 1/8 m Oriel grating monochromator with manual wavelength tuning. The exit slit was removed from the monochromator and the emergent light beam was then allowed to pass through the same aperture where the LED had previously been located. With this arrangement it was possible to maintain usable intensity over the wavelength region from 440 nm to 700 nm. Optical rotation measurements were then made at 10 nm intervals for 30 wt% solutions of each of the three sugars: sucrose, fructose and glucose.
The results are shown below left, in which the specific rotations (calculated from the observed rotation and the sugar concentrations in g/ml) are plotted against the measurement wavelength. Also shown are fits of the three datasets to the Drude expression above and the resulting parameters A and λ0.
Another way to view this data is to plot the inverse of the measured optical rotations vs the square of the wavelengths. The plot on the right shows the data after this transformation, resulting in linear plots, as expected.
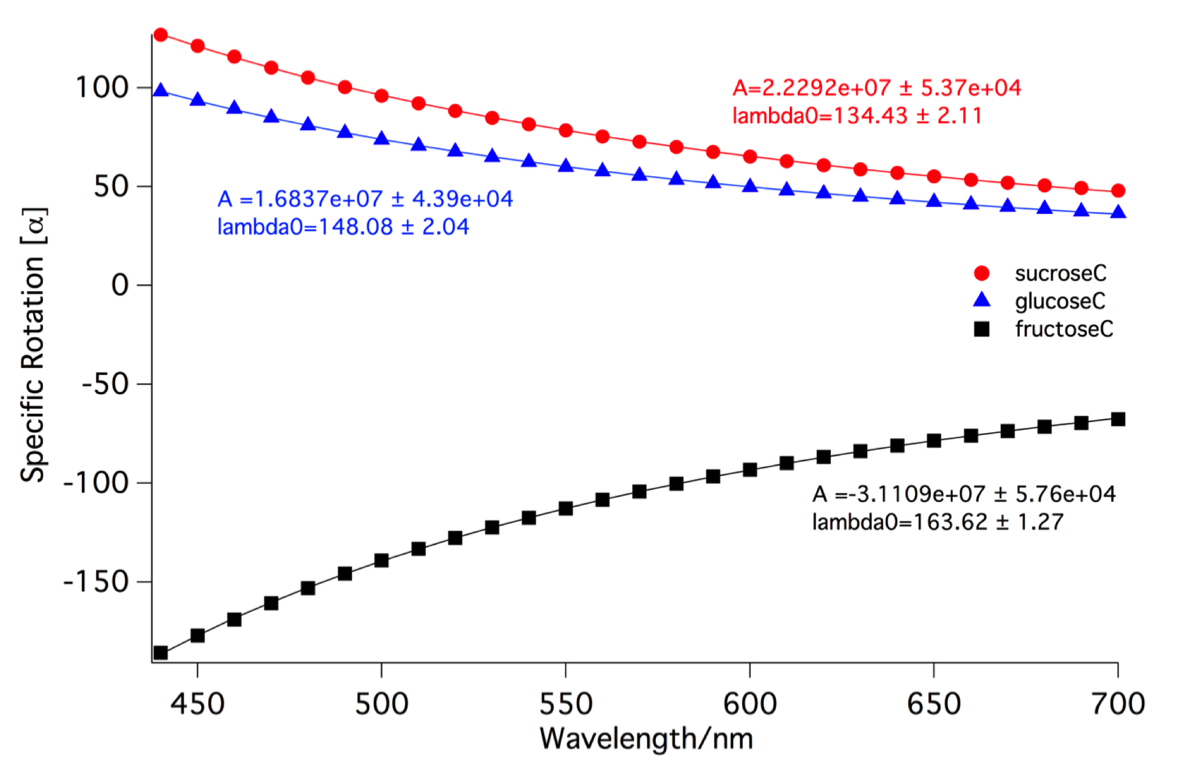
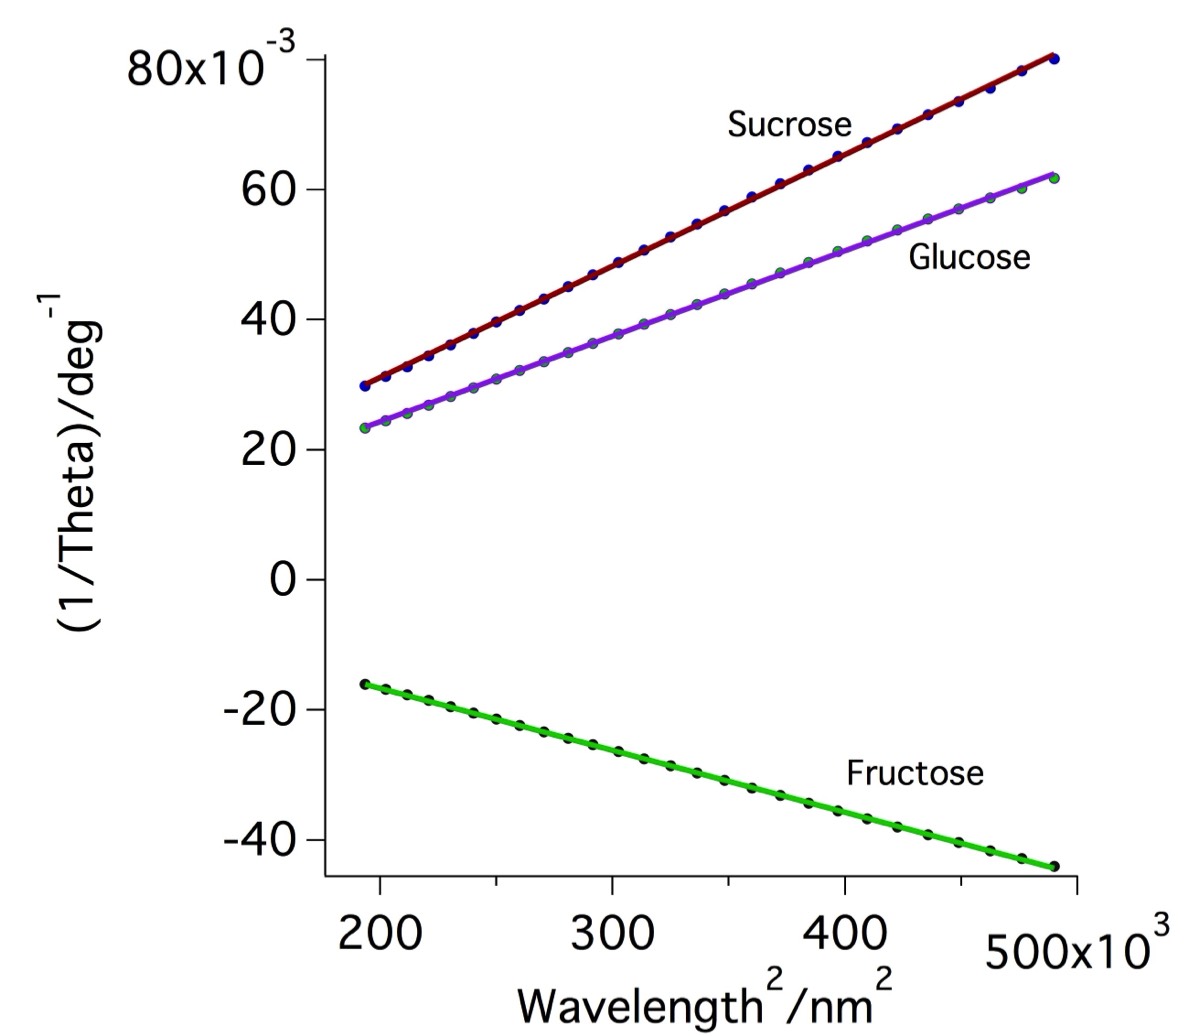
Left : Plots of specific rotation vs. wavelength for sucrose, glucose and fructose. Data points, fits and the two fit parameters are shown for each sugar based on the theoretical Drude expression describing the expected variation in specific rotation [α] as a function of wavelength, λ Units here are A : deg nm2 dm-1 (g/ml)-1 and λ0 : nm. Right : Linearised data obtained by plotting the inverse of the optical rotation vs the square of the wavelength.
As is apparent from the above experiment, a sugar solution (that is colourless) can clearly distinguish between different colours of light and can even be used to measure an LED's wavelength !
In order to perform polarimetric experiments that require the use of different source wavelengths, source PCB's can be populated with different LED's than the standard 590 nm yellow LED.