Instruments4Chem and PicoPOL
Instruments4Chem (I4C) develops low-cost, high-performance scientific instruments. Our products are sold through the official Instruments4Chem eBay store, with eBay providing secure payment processing, buyer protection, and order management.
Here we introduce our first instrument, PicoPOL: a novel LED-based, fully automatic polarimeter designed for high-quality quantitative optical rotation measurements. Results are reported within seconds, with no user intervention required. The instrument is equally well suited to single-point optical rotation measurements and to kinetic studies where automated data logging is needed.
Although most measurements use a yellow LED source to mimic the output of the traditional sodium lamp, our instrument can also accommodate alternative LED source PCBs, providing scope for measurements at other wavelengths.
The pages on this website describe how the instrument works, examine its performance, present sample experimental results, and provide firmware/software downloads together with detailed assembly and operating instructions. A substantial amount of information has been included to help you assess whether PicoPOL may suit the needs of your laboratory. For purchasing information, please visit the Instruments4Chem eBay store.
Using PicoPOL
PicoPOL is designed to provide rapid, high-quality optical rotation measurements with minimal setup. Typical use involves inserting a sample cell, initiating a scan, and obtaining a result within seconds.
The instrument can be used in two primary modes:
The instrument can be used in two primary modes:
- • Single-point measurements for routine optical rotation determination
- • Kinetic measurements with automated data logging
What do you Receive ?
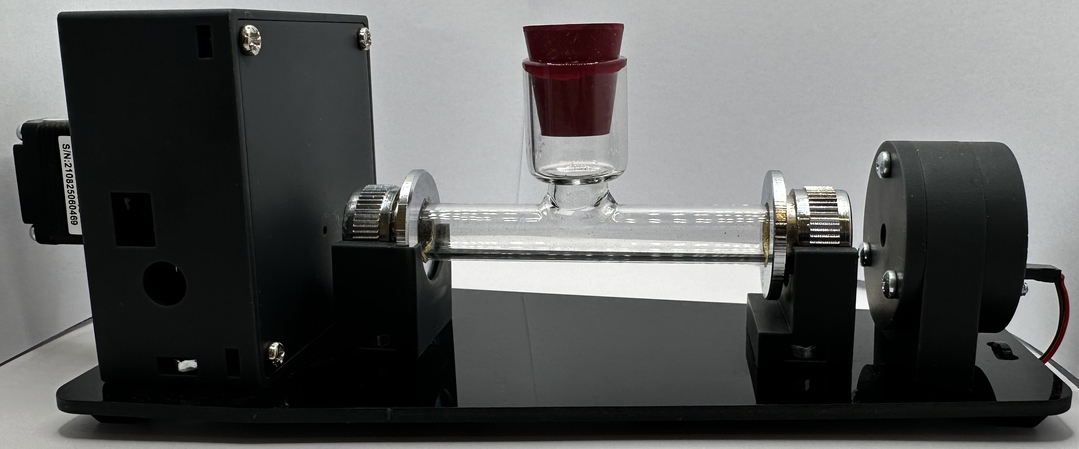
PicoPOL is supplied as a set of pre-built modules together with all mechanical components ready for setup:
- Source module (LED + polariser)
- Detector module (photodetector + stepper motor + analysing polariser)
- Controller module (RPi PICO-based)
- Validation module (a full instrument simulator to verify software installation)
- Laser-cut optical bench baseplate and mounting hardware
- Stepper motor and drive system
- Polarimeter cell
- Cables and assembly hardware
- PicoPOL-OLED — standalone operation with on-board display and remote control
- PicoPOL-PC — PC-based operation with LabVIEW interface
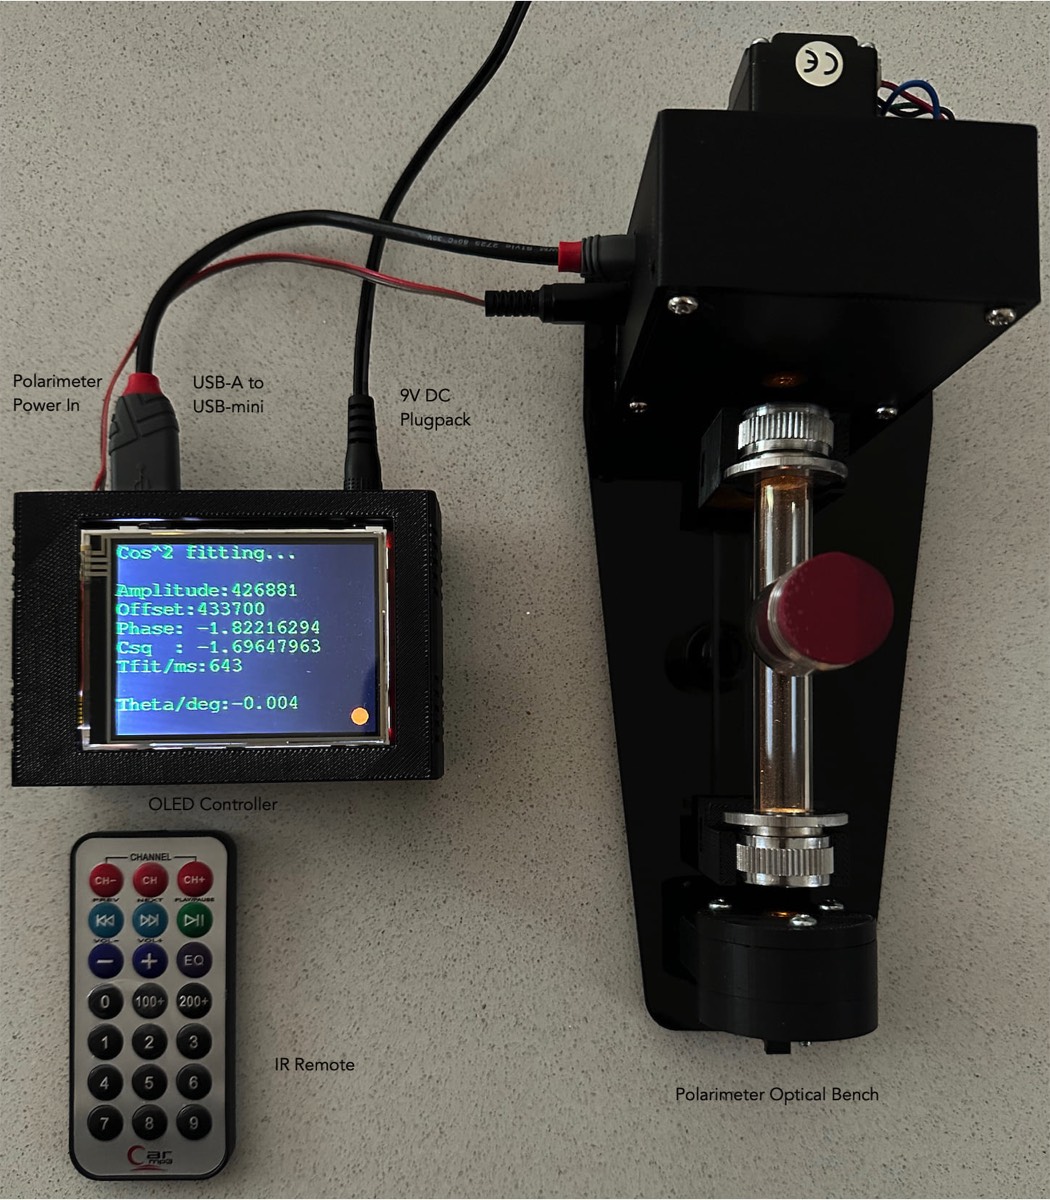
PicoPOL-OLED
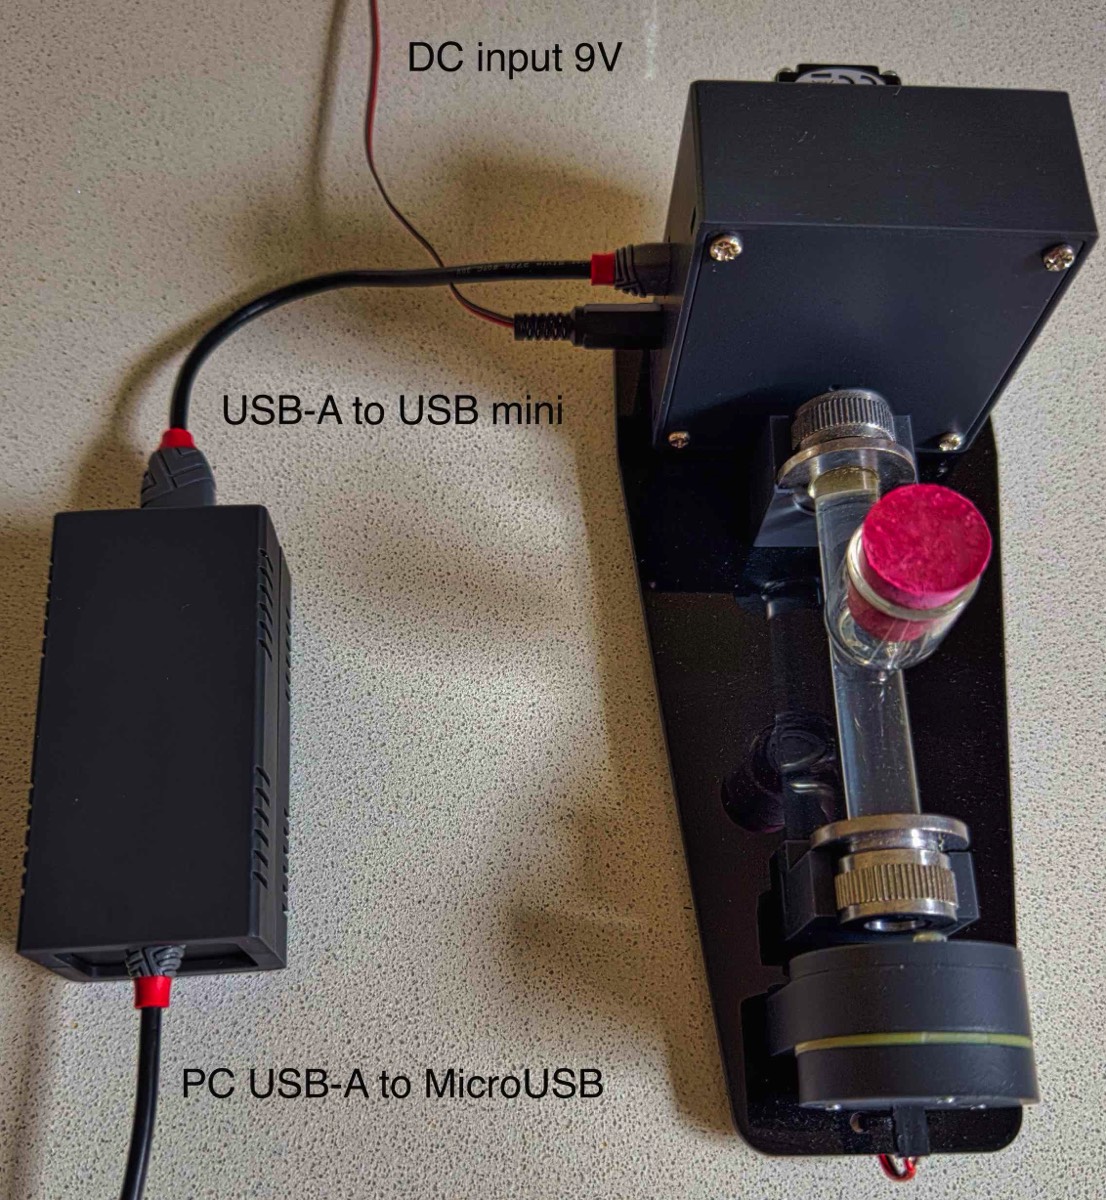
PicoPOL-PC
How Does It Work ?
Plane polarised light passes through the sample and into a rotating analyser. As the analyser rotates, the detected signal follows a sinusoidal variation (Malus’s Law).
PicoPOL records a full rotation of this signal (~8000 data points), and applies curve fitting to extract the phase of the waveform.
Optical rotation is determined by comparing:
PicoPOL records a full rotation of this signal (~8000 data points), and applies curve fitting to extract the phase of the waveform.
Optical rotation is determined by comparing:
- the phase of a blank measurement, and
- the phase of the sample measurement
What Can You Measure ?
Typical applications include:
- Optical rotation of standard solutions (e.g. sucrose)
- Concentration determination via calibration
- Reaction kinetics (e.g. sucrose hydrolysis)
- Demonstrations of chirality and optical activity
Typical Performance
With appropriate setup and warm-up:
- Optical rotation resolution: ~0.01°
- Typical accuracy: on the order of ±0.02°
- Drift: typically ~0.01° per hour after stabilisation
- optical alignment
- temperature stability
- LED wavelength characteristics
Getting Started (Basic Workflow)
- Setup the instrument (10–20 minutes)
- Connect a 9 V DC power supply
- Insert a blank sample (e.g. solvent) and record baseline
- Insert your sample and record measurement
- .Optical rotation is calculated automatically
Design Transparency
The PicoPOL polarimeter has been designed to be both functional and understandable. For users interested in the mechanical design, zip packaged .stl files are available for download for both the optical bench and the PICO controller.
All supplied components are professionally manufactured and ready to use—no 3D printing is required.
All supplied components are professionally manufactured and ready to use—no 3D printing is required.
Learn More
This site contains detailed information including:
- Instrument architecture and design
- Measurement methodology
- Example data (sucrose, quartz plates, kinetics)
- Performance evaluation and drift studies
Purchasing
PicoPOL systems are available via the Instruments4Chem eBay store.
👉 [View current availability and pricing]
👉 [View current availability and pricing]