Option 1 - PicoPol-OLED (OLED Display + IR Remote Keypad)
In both modes of operating the polarimeter we provide software that provides a convenient, easy-to-use GUI (graphical user interface). When running stand-alone, various informative OLED screens are accessed using the different keys on an IR remote.
The screen shown below left lists the various actions that can be initiated. Some of the important functions include zeroing the optical rotation on presentation of a blank, viewing the received polarimeter waveform, viewing the waveform fitting results, and displaying the optical rotation numerically.
On the right is the optical signal captured by the polarimeter after pressing the "2" key on the IR remote.
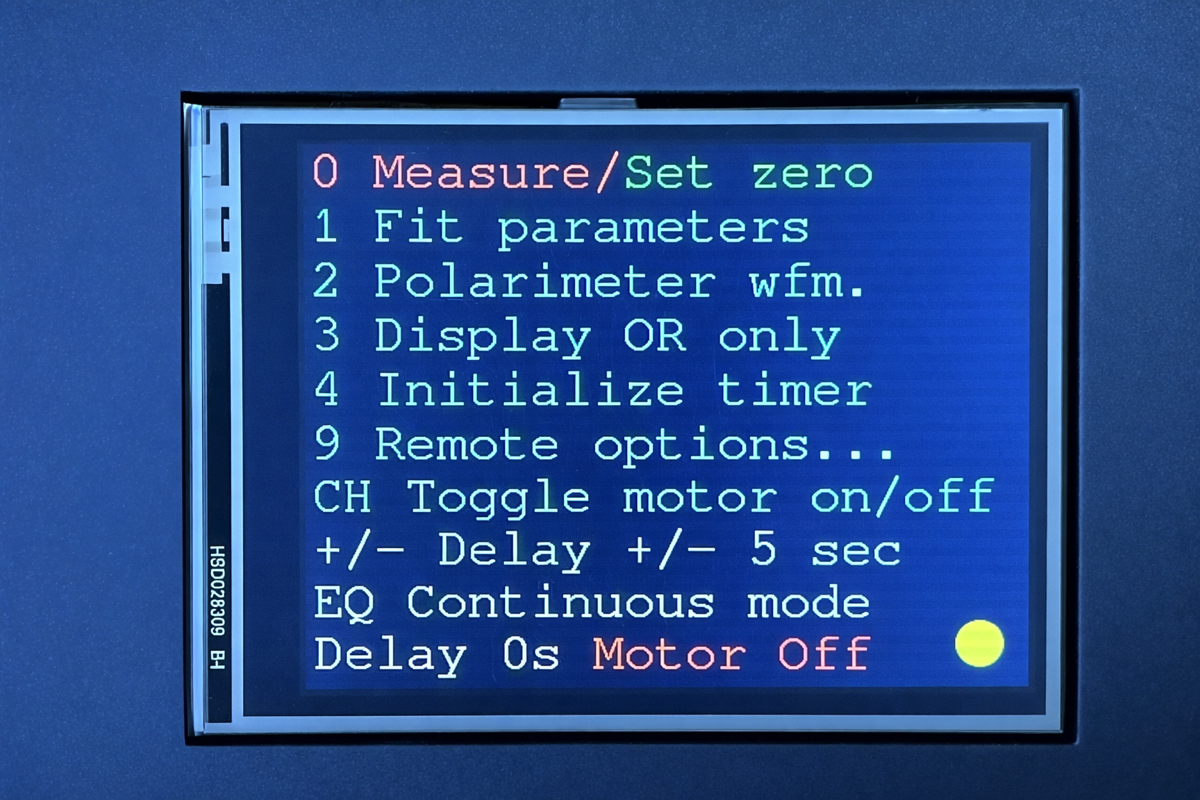
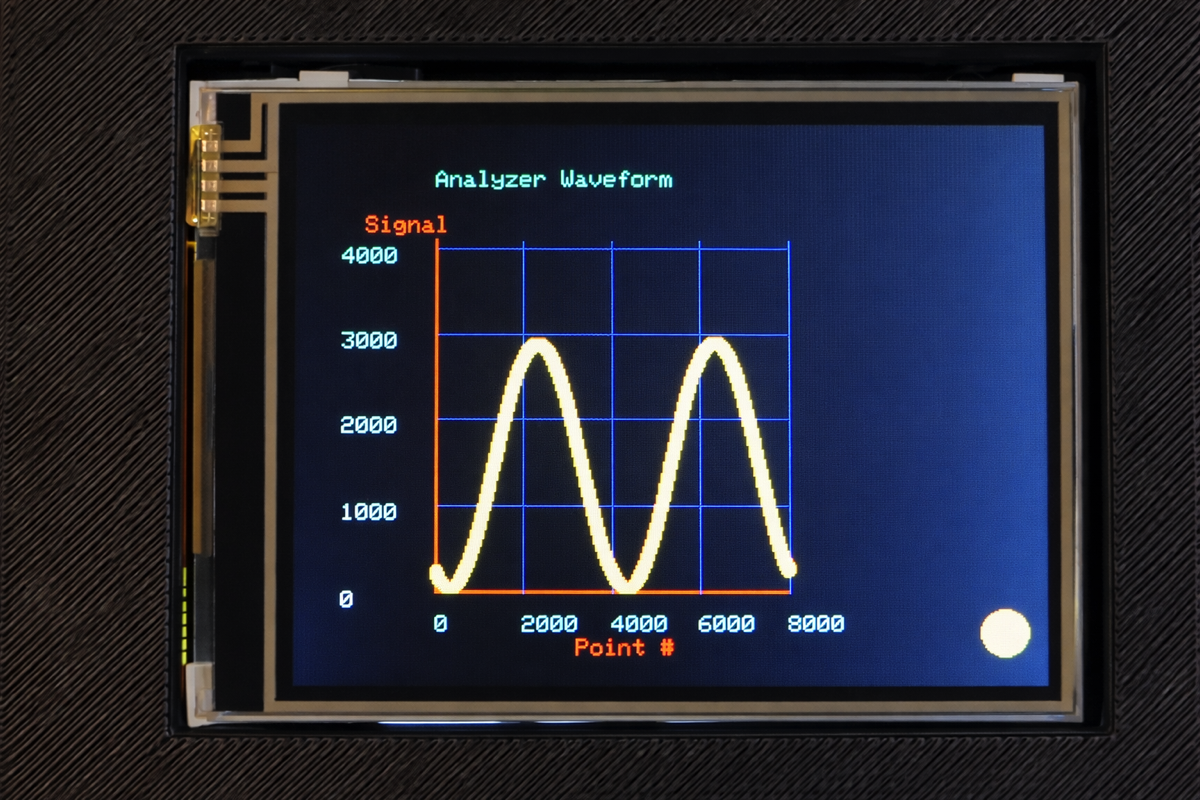
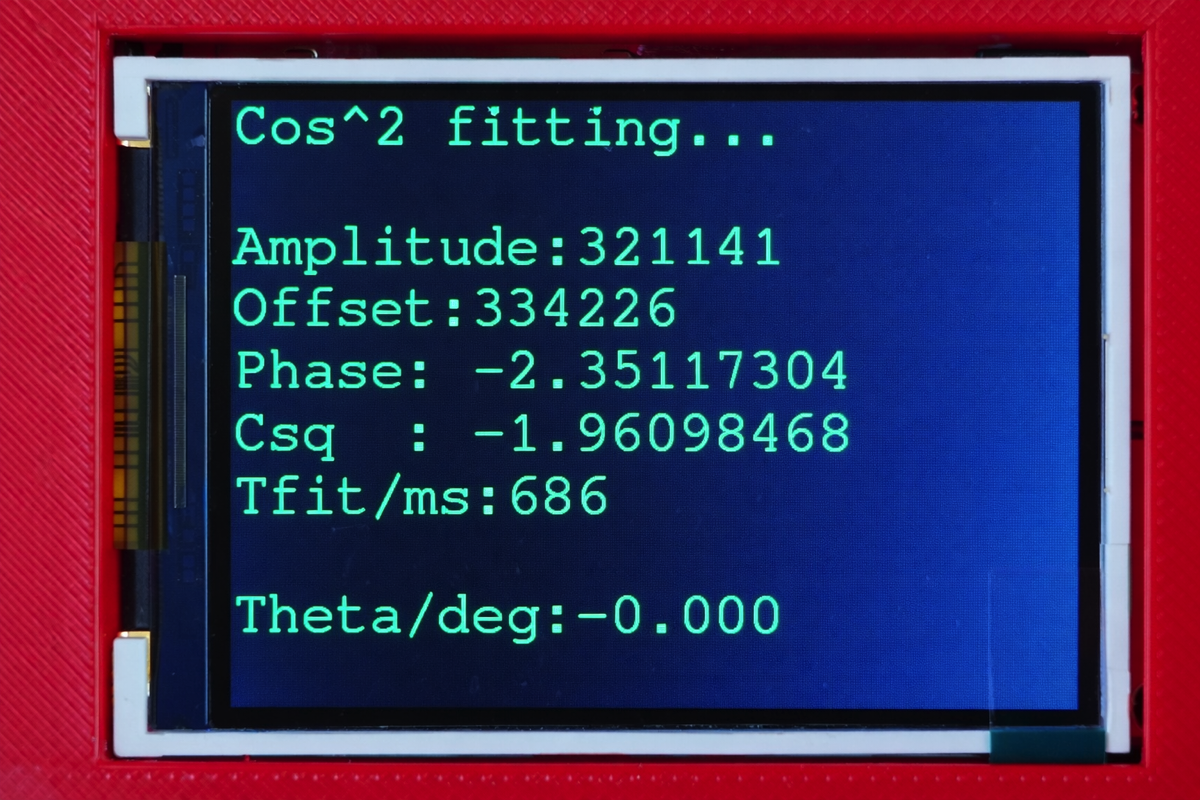
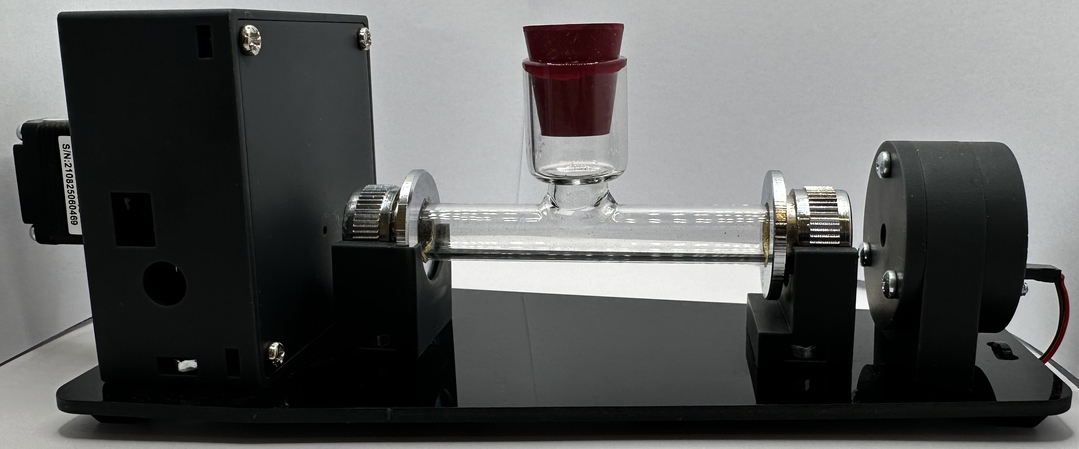
Interaction with the instrument in stand-alone mode is via an IR remote keypad. The screen at left shows the various modes accessible to the user (see this page for an explanation of these modes). In the centre is a single cosine squared waveform acquired by the instrument. A curve fitting algorithm extracts phase information from this waveform (rightmost image) and from this, the all important optical rotation can be obtained once a blank has been measured.
Option 2 - PicoPol-PC (PC Connectivity Using LabVIEWTM)
LabVIEWTM is a widely used software package for development of scientific instrumentation. Its powerful features save the user from the tedium of writing user interface code and much advanced signal processing capability is built-in. The LabVIEWTM control panel shown below allows a user to acquire data from the polarimeter and observe the processing/analysis of captured data. In this mode of operation the RPi PICO on the PicoPol-PC PCB is connected to a PC via a micro-USB cable.
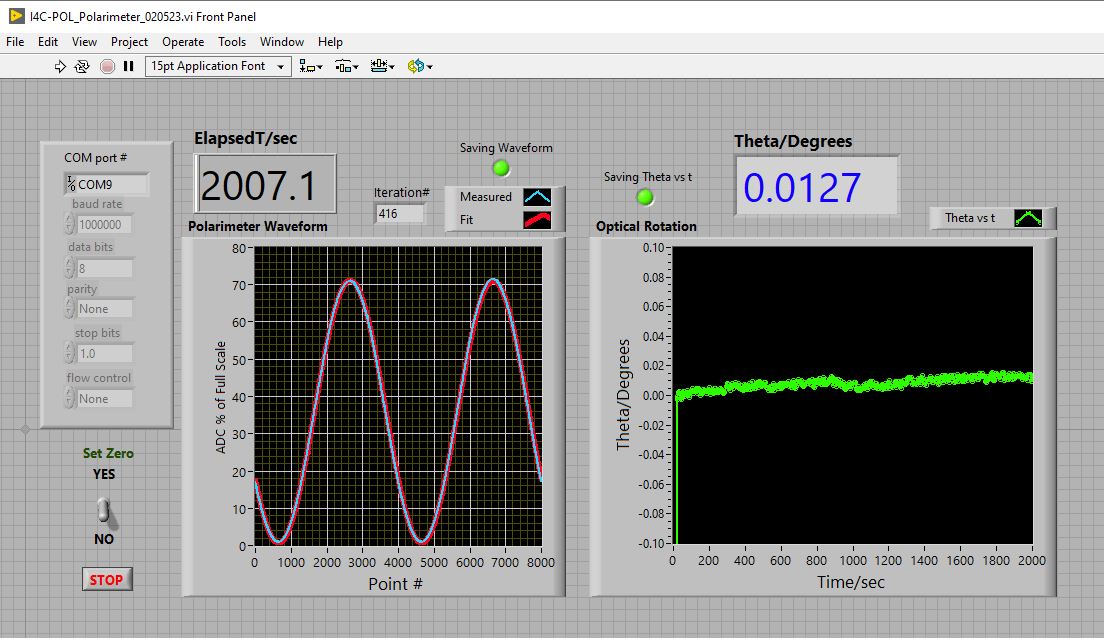
The LabVIEWTM control screen measuring a blank immediately following instrument power-up. The left trace shows an acquired waveform and a superimposed fit to a cosine squared function having amplitude, offset and phase parameters. The instrument was zeroed at the start of the run and measurements were undertaken for approximately 30 minutes (right trace). The data here is typical - there is a slight drift in the measured optical rotation at the commencement of a long run but this flattens out over time.
Clicking on the right arrow near the top left of the panel initiates data acquisition. The uploaded raw data is displayed as a blue trace, with the fitted curve superimposed as a red trace.. Optical rotations are calculated by the LabVIEWTM “virtual instrument” (vi) from the raw data and the results are displayed in a text field and as a green trace on a black background - where the readings are plotted against elapsed time.
On launch of the vi the user is offered the option of logging the optical rotation values and elapsed times into a data file if desired. Individual polarimeter waveforms can also be saved.
The instrument is zeroed at the start of a new experiment by toggling the SET ZERO switch to the “YES” position, waiting a few seconds until the instrument shows an Optical Rotation of ~ 0.000 degrees, then toggling the SET ZERO switch back to “NO”. This SET ZERO operation is carried out with a polarimeter cell containing a blank solution in-place; this stores the phase measurement for the blank for later use when a sample phase is measured.