Accuracy - Quartz Calibration Plate Tests
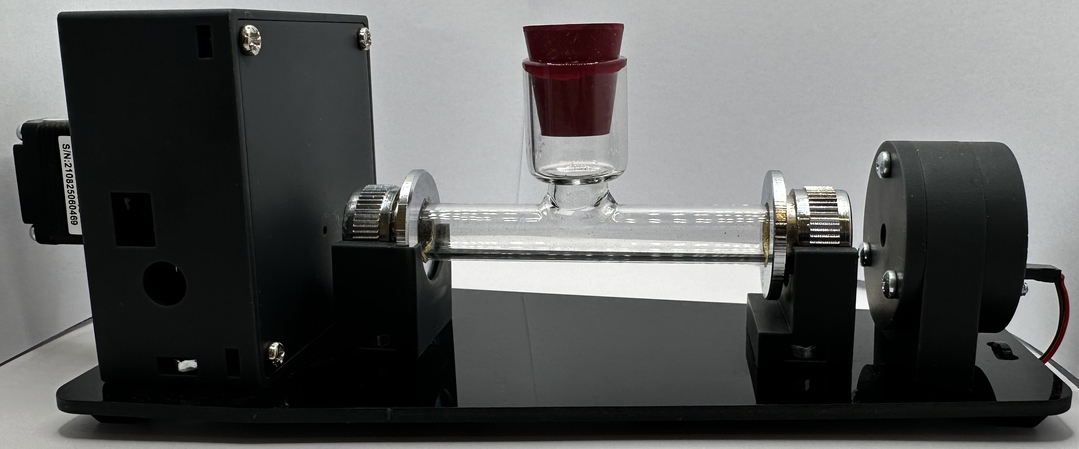
To assess the accuracy of our polarimeter we used a quartz calibration plate (Rudolph, serial #8393-8114). The optical rotation of this plate is certified to an accuracy of 0.0010 at various wavelengths. (Quartz is an optically active material, a discovery made by the French physicist Dominique Arago way back in 1811).
The Rudolph calibration plate is actually comprised of two plates giving optical rotations (at the Na D line wavelength) of #8393 : +10.9940 and # 8114 : -21.9790 ; in combination these yield an optical rotation of -10.9850 at 589.44 nm.
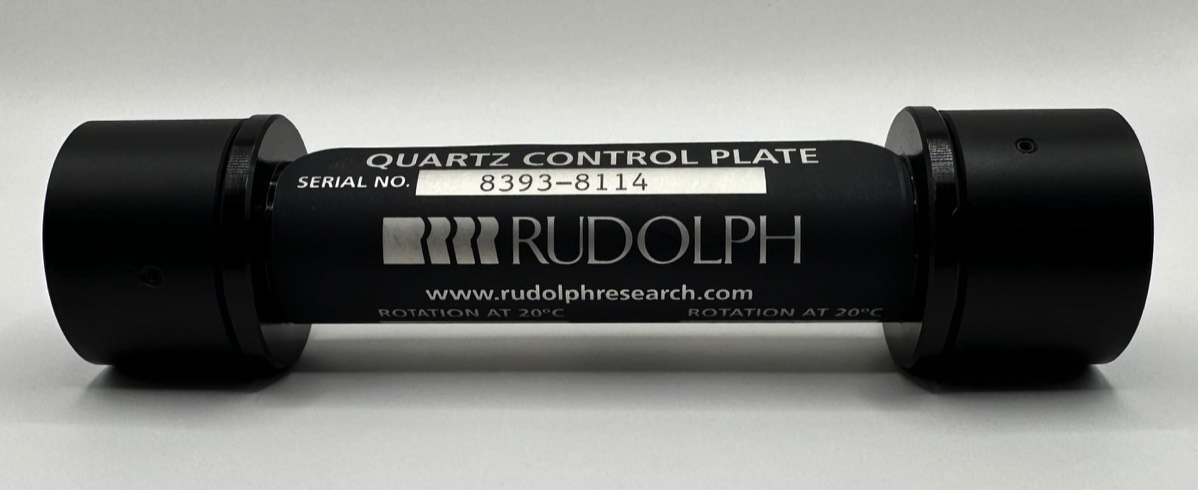
A commercial control plate fitted with two pieces of quartz, one at each end. This can be used to obtain 3 accurately known optical rotation values for testing the instrument - see the text below for details.
Measurements using the two certified Rudolph quartz calibration plates (8393, 8114) individually and in combination demonstrate that PicoPOL instruments exhibit strong internal consistency and good linearity, with some variation between individual units. Results are shown in the table below for 6 different PicoPOL builds.
For four of the six instruments tested, the calculated sum of the individual plate measurements agrees with the directly measured combined plate value to within ±0.02°, confirming excellent additivity and linear response. These results indicate that, in typical builds, the instrument behaves as expected for a well-aligned polarimeter operating at a well defined effective wavelength.
Two instruments show larger deviations in the summation test (up to ~0.06–0.09°). While still small in absolute terms, these results suggest that additional sources of measurement uncertainty—such as alignment sensitivity, mechanical stability, or reading variability—can contribute at this level in some builds.
Across all instruments, the measured values for the individual plates show a consistent systematic offset relative to the certified values: positive rotations are slightly underestimated, and negative rotations are slightly reduced in magnitude. This behaviour is characteristic of a wavelength-dependent effect and is consistent with small variations in the dominant wavelength of the LED light source.
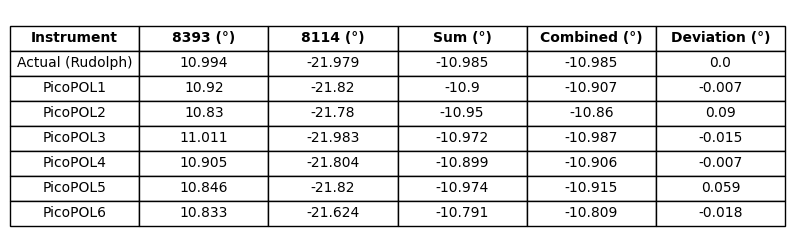
Optical rotation measurements for two quartz calibration plates recorded individually and together (Combined column). The Sum column shows the algebraic sum of the two individual plate readings and the deviation column is the difference (Combined - Sum).
The influence of LED wavelength on the measured optical rotation can be demonstrated directly. Measurements obtained using another PicoPOL-PC instrument prior to wavelength adjustment gave values of +10.864° for plate 8393, −21.738° for plate 8114, and −10.884° for the combined plates, showing the expected reduction in magnitude associated with operation at a slightly longer effective wavelength. The calculated sum of the individual plate measurements here (−10.874°) is in close agreement with the directly measured combined value (−10.884°), confirming that linearity is preserved despite the wavelength offset.
In a custom implementation - using a 600 nm interference filter (Optometrix #2-6002) mounted on a micro-rotation stage (Standa #7R128) - we are able to angle tune the effective wavelength. With the #8393 calibration plate placed in the light path, the filter was rotated away from normal incidence to obtain the standard’s reading of +10.990. After doing this the Rudolph calibration plate measured values shifted to +10.986°, −22.001°, and −10.997°, in close agreement with the certified values (deviations are now just –0.0080, -0.0220 and -0.0120, respectively).. The corresponding summed optical rotation (−11.015°) again closely matches the combined measurement (−10.997°), confirming consistent additivity after wavelength adjustment.
This wavelength-tuning experiment demonstrates that the observed systematic offsets arise from differences in effective LED wavelength rather than from measurement error. It also confirms that the PicoPOL system maintains good linearity under both conditions.
Optical rotation in quartz depends strongly on wavelength, and commercially available yellow LEDs typically exhibit unit-to-unit wavelength variations of several nanometers. The observed offsets are therefore consistent with each instrument operating at a slightly different effective wavelength. Importantly, this wavelength-related bias is systematic within each instrument and does not affect linearity, as evidenced by the close agreement between summed and combined measurements in most cases.
Overall, the results show that PicoPOL provides:
• Good reproducibility across independently assembled instruments
• Strong linearity and additivity in typical builds
• Predictable, wavelength-dependent offsets arising from LED source variation
For measurements on a given substance such as sucrose, the strong linearity of the PicoPOL system means that a reference measurement on a standard solution (for example, a sucrose solution with a known optical rotation) can be used to derive a simple scaling factor to align measured values with accepted reference data where comparison with literature values is required.
However, for most analytical applications this is not necessary. When constructing a calibration curve (e.g. optical rotation versus concentration), any wavelength-dependent scaling is inherently incorporated into the calibration, and the resulting measurements are internally consistent without further adjustment. Applying an additional correction in such cases offers no practical benefit and is not recommended.
It should also be noted that low-cost polarimetry cells may exhibit small variations in optical path length (for example, deviations of a few millimetres from the nominal 10 cm length). Such variations directly affect measured rotation and represent an additional source of systematic difference when comparing absolute values.
In summary, if the measurement wavelength is adjusted to match that of the Na emission, the PicoPOL polarimeter is capable of determining an optical rotation to an accuracy of ~ 0.020.
Optical Rotation - Drift Over Time
To realize and maintain this accuracy over a period of time, it is important to characterize the instrument’s drift. The graph below compares blank-zero stability traces from five independently built PicoPOL instruments over extended runs of up to three hours. The traces are not identical in shape, but all remain within a small absolute drift range measured in hundredths of a degree. Significantly, over the entire measurement period the optical rotation in all of these traces remains stable to within ~0.020.
This data shows that the PicoPol's long term drift is no worse than the optical rotation measurement accuracy. In much more expensive polarimeters, the temperature of the sample is carefully controlled, but the additional cost and complexity to incorporate this capability was not deemed warranted for the PicoPol system. This is borne out by simulations to be described next.
For many routine measurements, where optical rotations of a few degrees or more are being measured and blank and sample readings are taken within a short time of one another, this level of drift is insignificant. Long-duration kinetic measurements are the most sensitive to residual instrument drift and benefit from warm-up, blank zeroing, and a mechanically stable setup.
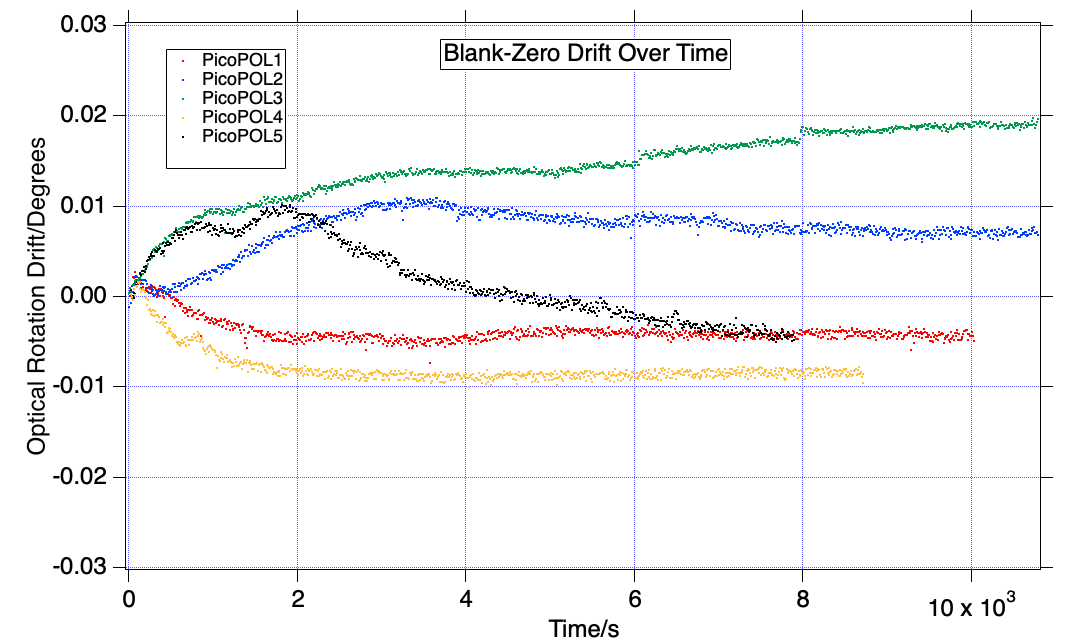
Drift measurements for 5 different PicoPOL instruments after zeroing immediately on power-up.
Intrinsic Precision Estimation
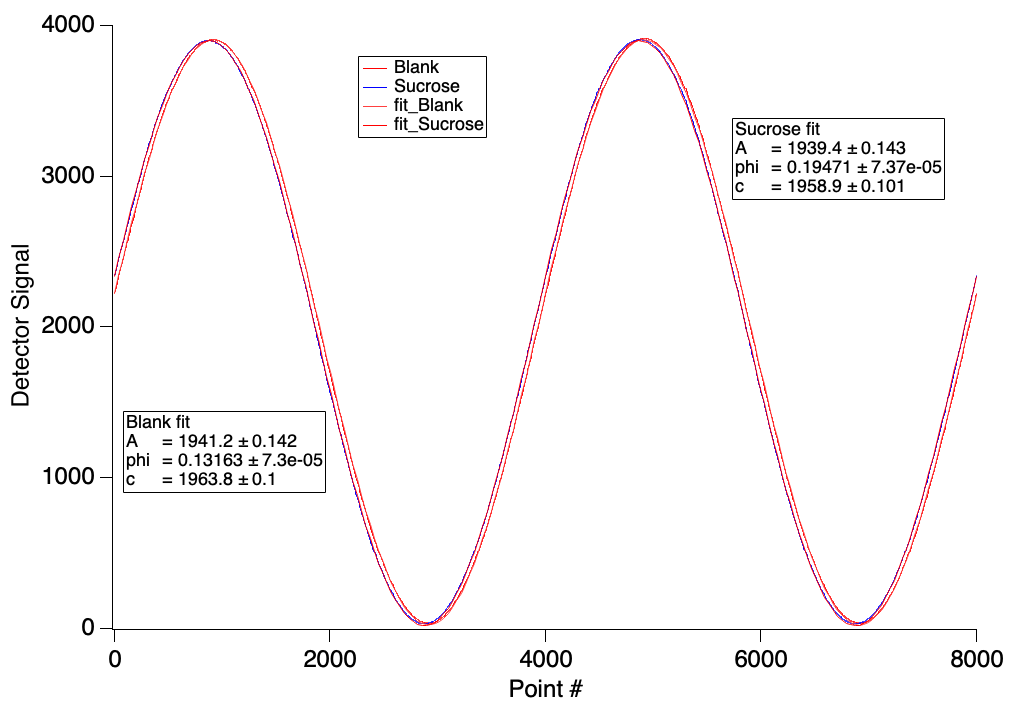
To determine the intrinsic statistical precision of the waveform fitting method employed by PicoPOL we saved waveforms first for a blank and then for a sucrose solution containing 1.58 g of sucrose per 50 ml (see below).
In PicoPOL the optical rotation is determined by fitting the detector waveform recorded during analyzer rotation to a sinusoidal model : y(n) = A sin(ω n + φ) + c, where the frequency term ω is fixed. Using data shown in the two text boxes, the phase difference here is 0.0630795 radians, but because the waveform phase changes at twice the optical rotation angle is θ = Δφ / 2 = 0.0315398 radians = 1.807°.
Using the fit uncertainty values the phase difference uncertainty is σΔφ = sqrt(σφb2 + σφs2) = 1.04× 10⁻⁴ radians. This translates into an optical rotation uncertainty of σθ = σΔφ / 2 ≈ 5.2 × 10⁻⁵ radians ≈ 0.003°.
Instrument Simulations
Simulations can offer valuable insights into how an instrument can be expected to perform and can also point to areas for improvement. Here, our goal is to simulate the detector response as the analysing polarizer rotates relative to the fixed defining polarizer, as this is the essential basis for the optical rotation measurements.
To be realistic our simulation incorporates
(i) the broadband nature of the LED’s emission spectrum,
(ii) the variation of the specific rotation of the sample as a function of wavelength,
(iii) the spectral response of the detector and
(iv) the temperature at which measurements are performed.
The commercially available modelling package ExtendSim 9 has been used, supplemented by additional spectroscopic libraries that enhance the capabilities of this package. These libraries contain pre-built “polychromatic blocks” – these are a set of optoelectronic components that can be “wired-up” to create both a pictorial and functional representation of an instrument.
The ExtendSim model of the PicoPol is shown below. In this model, the LED source is represented by the polychromatic “lamp” block (A). The output of this block passes through a polarizer (B), then through the optically active sample (C) – in this case sucrose, and finally a Faraday rotator (D) and second polarizer (E) before reaching the detector (F) – the latter is a photodiode/preamplifier block.
The Faraday rotator block rotates the polarization of incident light by an amount that is proportional to a control signal applied at its input terminal. Consequently, we use a ramp block to drive this input, thereby simulating the motion of the analyzing polarizer in the real instrument. In the upper section of the model there is an independent light path having a second photo-detector that simply omits the sample to simulate the behaviour for a non-optically active “blank”.
Also included on the model sheet is a “global parameters” block – this defines a vector of wavelengths that are used in the calculations at each step in the simulation. Importantly, this allows the simulation to model the behaviour of our instrument over the LED’s full spectrum of emission wavelengths.
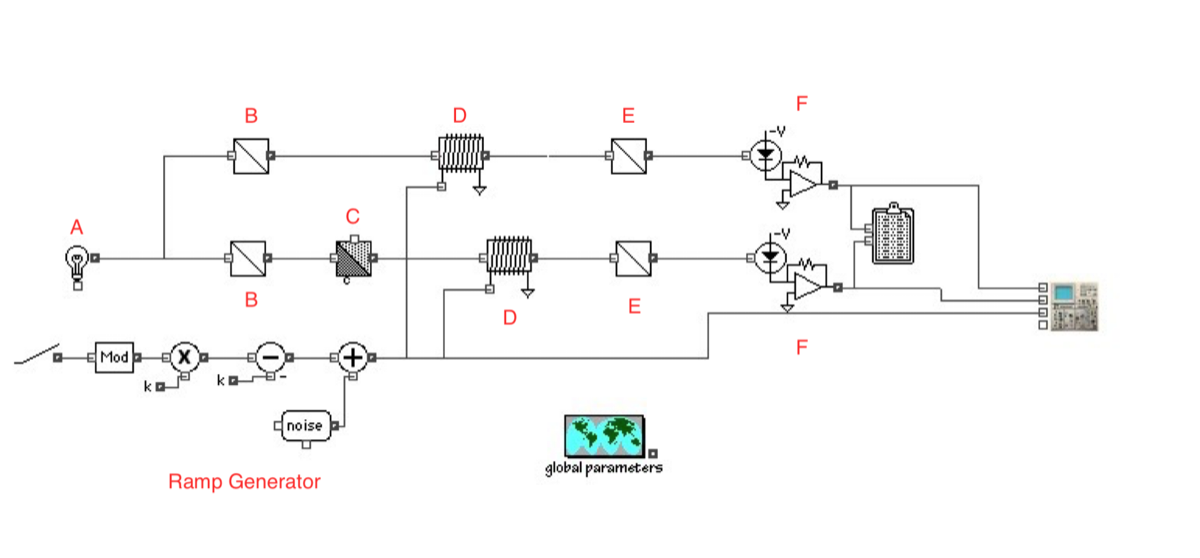
An ExtendSim model of the PicoPol Polarimeter
For polarimetric measurements on sucrose the ICUMSA (the International Commission for Uniform Methods of Sugar Analysis) standard specifies a weight fraction of 0.23701775, corresponding to 26.000 g of sucrose per 100 cm3 of solution at 20 °C. This solution has a density of 1097.6393 kgm-3. The standard quotes an optical rotation of 40.7770 for this solution when measured in a 20.000 cm cell at a wavelength of 546.2271 nm.
The ICUMSA standard supplies the coefficients needed to calculate the specific rotation of sucrose at the mercury (Hg) emission wavelength (546 nm) - α546 – doing so via a quintic polynomial in the weight fraction of sucrose with an additional cubic correction applied with respect to the temperature deviation from 20 °C. The specific rotation for a chiral compound [α] is related to its measured optical rotation θ at a known concentration c in a cell having path length l via
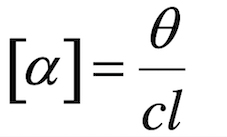
Showing conventional units for the various quantities and noting that specific rotation is both temperature and wavelength dependent, we can write

Additional coefficients allow [α546] to be converted into an alpha value at any other wavelength, [αλ] by means of the reciprocal of a sextic polynomial in even powers of the wavelength. The custom sample block (C) developed for sucrose in the ExtendSim model above incorporates the ICUMSA methodology.
For reference, a 0.26000 g ml-1 sucrose solution is then found to have an optical rotation of 17.3130 (measured in a 10 cm cell) and a specific rotation [α]=66.547 deg g/ml-1 dm-1 at the Na D line wavelength (589.44 nm).
Prior to running simulations, various data files are imported into the model – these include the measured emission profile of the LED (into the lamp block), the molar extinction coefficient of the sample, if relevant (into the optical activity block) and the spectral response of the photodetector (into the photodiode/preamplifier block).
As the simulation is running, an oscilloscope block on the worksheet displays the outputs of the two photo-detectors as well as the ramp signal that is applied to the Faraday rotators. The two detector outputs are also written to a spreadsheet file that is used for subsequent analysis.
Typical results simulating a single rotation of the analysing polarizer can be seen below, in which the “blank” trace appears in black and the sample trace in red. The simulation shows the predicted detector waveforms for a 0.260 g/mL sucrose sample in a 10 cm cell. Motion of the analysing polarizer results in a cosine squared modulation of the light intensity. Relative to the black (blank) trace the red trace (sample) shows a left shift - this indicates a positive phase change and therefore a positive optical rotation.
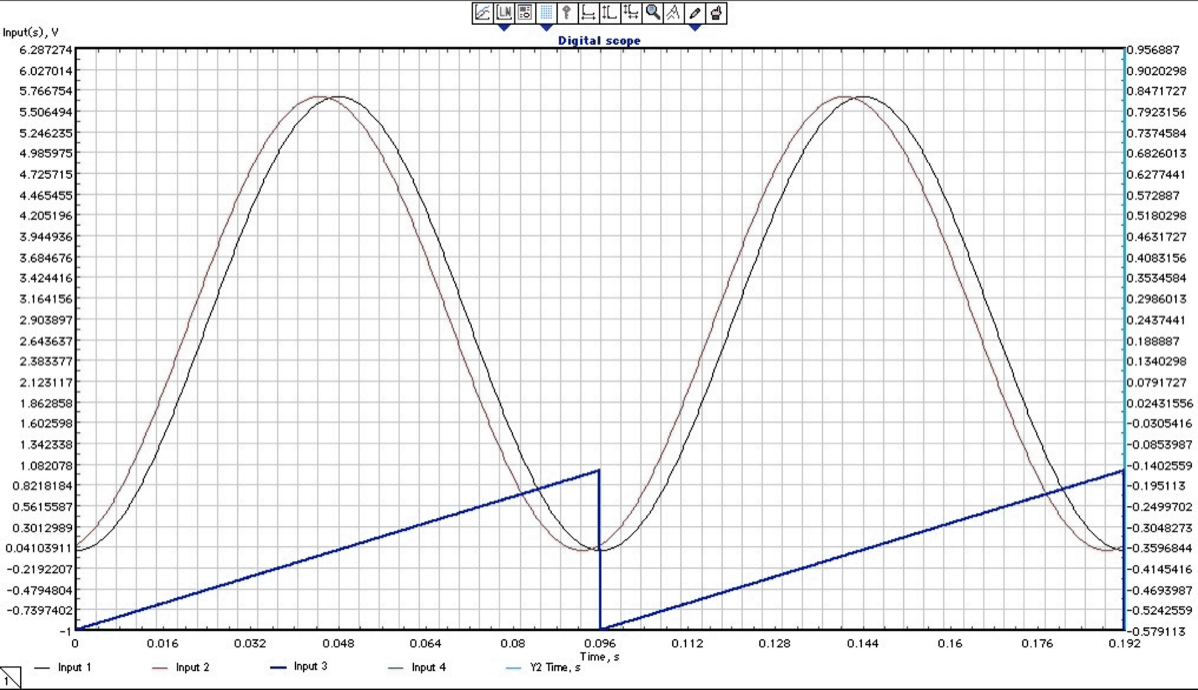
The blue trace in the above plot shows the modulation waveform that is applied to the two Faraday rotator blocks in the model. The simulation commences with crossed polarizers (-900), then parallel (00), then crossed again (+900) before the cycle is repeated, simulating a full 3600 rotation of the analysing polarizer in the actual instrument. Here, the blank trace is in black; the sample trace in red - note the phase shift.
In this simulation there is no assumed optical attenuation of the light accompanying its passage through the sample (i.e. the sample’s extinction coefficient was set to zero at all wavelengths).
Pairs of waveforms as computed above are then subject to curve fitting (to a cosine squared function), from which optical rotations are obtained. Results obtained in four runs assuming different LED peak wavelengths (these assumed a full-width-at-half-maximum of 16 nm) are 594 nm (17.0350), 591 nm (17.2210), 589.44 nm (Na) (17.3180) and 586 nm (17.5360). An additional run that simulated a source emitting the yellow Na D lines yielded the expected result of 17.3130.
It was demonstrated above that the PicoPol is capable of a measurement accuracy of around 0.020. From the data presented here it is evident that any differences in measured optical rotations for sucrose solutions when measuring with an LED as opposed to a Na lamp are not an indication of errant performance, but are instead attributable to the different source wavelength.
Some pertinent overall simulation findings for our 0.26 g/mL sucrose solution are:
(a) For a fixed source bandwidth of 16 nm, the optical rotation of this solution changes by ~ 0.06250 per nm relative to the value measured at the Na D line wavelength of 589.44 nm, with its value increasing as the wavelength decreases. In percentages, this represents a difference of ~ 0.36% per nm when comparing an optical rotation measured by an LED-based instrument compared to one made using a Na lamp. The change in specific rotation [α] with wavelength is 0.242 deg (g/ml)-1 dm-1 per nm.
(b) For a fixed peak wavelength near 590 nm, the optical rotation decreases only very slightly (0.0150) as the source bandwidth varies from 2 nm to 20 nm – i.e. the source bandwidth has a very minimal effect on the results.
(c) The effect of temperature is negligible compared to the measurement accuracy of this instrument. (vs for runs at λ =589.44 nm, FWHM 16 nm, T’s of 18 and 30 °C)